Hot US Stocks
Derived from the 50 most active stocks priced over $5 listed on any U.S. Exchange (NYSE, Nasdaq, OTCBB, etc.). The default setting shows stocks starting from $5.00, however any minimum and maximum price can be entered by specifying the price range below and clicking on the go button.
Min Price:
Max Price:
| Chart | Company Name | Volume | Price | High | Low | Open | Change | BI Rating |
 FCUV
FCUV
| Focus Universal Inc. | 97,708,105 | $11.6 | $17.59 | $8.42 | $10.22 |
517.02%
|

|
 ^VOLA
^VOLA
| NYSE MKT (AMX) Total Volume / 1000 | 291,305,546 | $291305.55 | $291305.55 | $0 | $3.958 |
18.29%
|

|
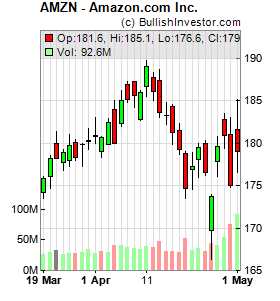 AMZN
AMZN
| Amazon.com Inc. | 128,430,299 | $271.58 | $273.23 | $262.01 | $265 |
15.32%
|
|
 NWL
NWL
| Newell Brands Inc. | 44,330,430 | $5.6 | $7.1299 | $5.495 | $6.6 |
8.95%
|

|
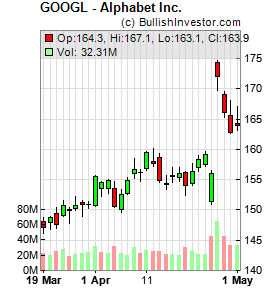 GOOGL
GOOGL
| Alphabet Inc. | 46,244,882 | $356.13 | $358.58 | $340 | $340.83 |
6.73%
|
|
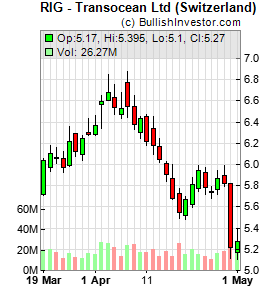 RIG
RIG
| Transocean Ltd (Switzerland) | 62,752,493 | $5.32 | $5.34 | $5.09 | $5.14 |
4.72%
|
|
 ^VOLR
^VOLR
| ^VOLR | 2,044,884,641 | $2044884 | $2044884 | $0 | $0.001 |
3.59%
|
|
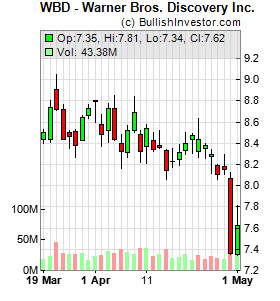 WBD
WBD
| Warner Bros. Discovery Inc. | 36,929,375 | $26.3 | $26.45 | $25.4 | $25.435 |
3.26%
|
|
 PATH
PATH
| UiPath Inc. Class A | 39,780,680 | $12.76 | $12.82 | $12.16 | $12.27 |
3.15%
|
|
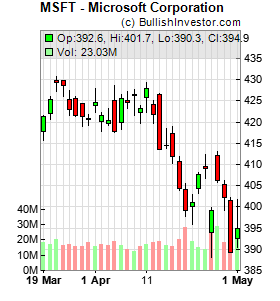 MSFT
MSFT
| Microsoft Corporation | 60,501,802 | $464.72 | $466.84 | $449.33 | $450 |
3.02%
|
|
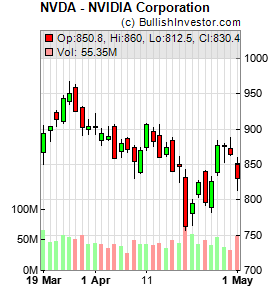 NVDA
NVDA
| NVIDIA Corporation | 138,812,377 | $200.75 | $202 | $194.95 | $198.4405 |
2.93%
|
|
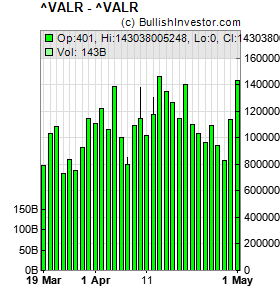 ^VALR
^VALR
| ^VALR | 169,385,015,219 | $169385015000 | $169385015000 | $0 | $1316 |
2.53%
|
|
 TQQQ
TQQQ
| PROSHARES TRUST | 85,476,137 | $64.62 | $66.77 | $62.3852 | $65.74 |
2.09%
|
|
 TSLL
TSLL
| Direxion Daily TSLA Bull 2X ETF | 85,129,647 | $7.31 | $7.5187 | $6.8801 | $7.24 |
1.39%
|
|
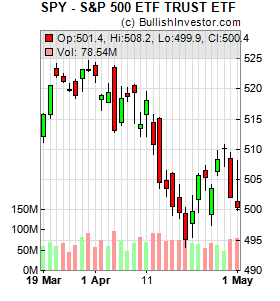 SPY
SPY
| State Street SPDR S&P 500 ETF Trust | 59,136,861 | $747.03 | $748.895 | $737.68 | $744.68 |
0.72%
|
|
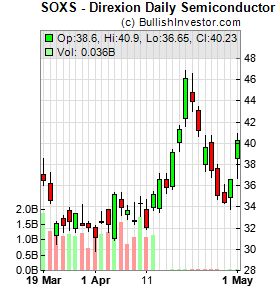 SOXS
SOXS
| Direxion Daily Semiconductor Bear 3X | 95,337,505 | $54.27 | $55.2 | $45.18 | $47.07 |
0.65%
|
|
 QQQ
QQQ
| INVESCO QQQ Trust | 49,255,194 | $687.99 | $695.77 | $680.0512 | $692.11 |
0.65%
|
|
 NOK
NOK
| Nokia Corporation Sponsored American Depositary Shares | 91,302,459 | $9.14 | $9.54 | $9.05 | $9.42 |
0.55%
|
|
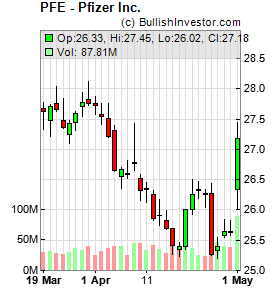 PFE
PFE
| Pfizer Inc. | 43,515,805 | $25.01 | $25.18 | $24.67 | $24.82 |
0.40%
|
|
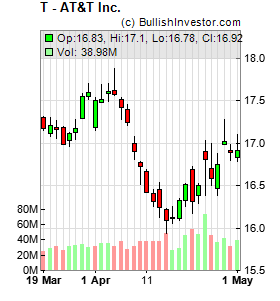 T
T
| AT&T Inc. | 58,127,427 | $23.25 | $23.46 | $22.915 | $23.17 |
0.17%
|
|
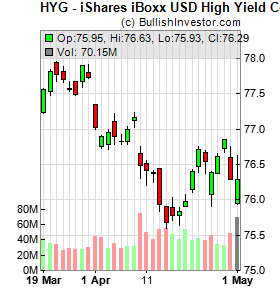 HYG
HYG
| iShares iBoxx USD High Yield Corporate Bond ETF | 38,569,920 | $79.48 | $79.535 | $79.24 | $79.46 |
0.01%
|
|
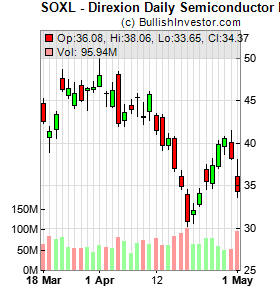 SOXL
SOXL
| Direxion Daily Semiconductor Bull 3X | 100,186,734 | $114.72 | $133.88 | $112.42 | $129.9 |
0.00%
|
|
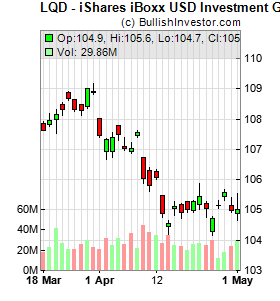 LQD
LQD
| iShares iBoxx USD Investment Grade Corporate Bond ETF | 40,853,891 | $106.25 | $106.345 | $105.995 | $106.24 |
-0.15%
|
|
 TLT
TLT
| iShares 20+ Year Treasury Bond ETF | 49,804,981 | $82.25 | $82.45 | $81.89 | $82.45 |
-0.66%
|
|
 SPDN
SPDN
| Direxion Daily S&P 500 Bear 1X | 72,400,644 | $8.71 | $8.82 | $8.69 | $8.74 |
-0.80%
|

|
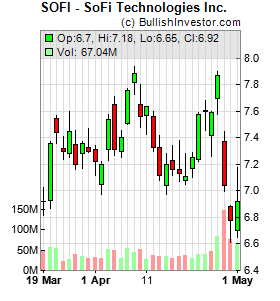 SOFI
SOFI
| SoFi Technologies Inc. | 56,432,711 | $16.31 | $16.5 | $15.8314 | $16.44 |
-0.97%
|
|
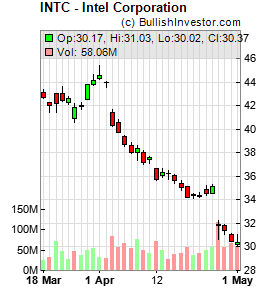 INTC
INTC
| Intel Corporation | 104,712,506 | $90.2 | $97.9 | $90.13 | $96.72 |
-1.02%
|
|
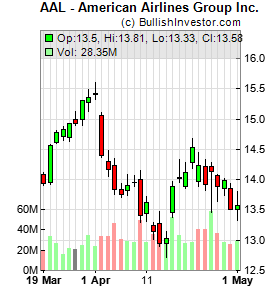 AAL
AAL
| American Airlines Group Inc. | 48,025,025 | $15.27 | $15.525 | $15.17 | $15.49 |
-1.04%
|
|
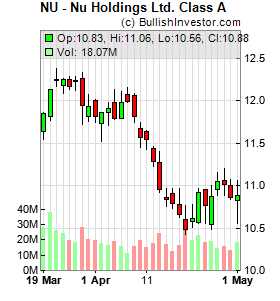 NU
NU
| Nu Holdings Ltd. Class A | 47,515,554 | $14.33 | $14.575 | $14.235 | $14.48 |
-1.10%
|
|
 ONDS
ONDS
| Ondas Inc | 59,041,681 | $7.49 | $7.83 | $7.11 | $7.72 |
-1.19%
|
|
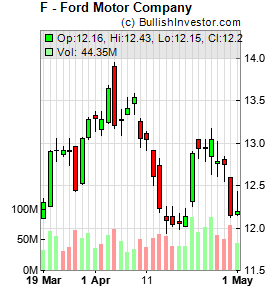 F
F
| Ford Motor Company | 54,425,335 | $14.68 | $15.03 | $14.41 | $14.96 |
-1.21%
|
|
 SQQQ
SQQQ
| PROSHARES TRUST | 59,266,394 | $43.73 | $45.28 | $42.2157 | $42.9298 |
-1.99%
|
|
 SMR
SMR
| NuScale Power Corporation Class A | 38,620,826 | $8.42 | $9.01 | $8.385 | $8.875 |
-2.09%
|
|
 BITO
BITO
| ProShares Bitcoin ETF | 83,289,466 | $8.52 | $8.64 | $8.43 | $8.63 |
-2.85%
|
|
 IBIT
IBIT
| ISHARES BITCOIN TR | 55,386,847 | $35.64 | $36.115 | $35.29 | $36.11 |
-2.89%
|
|
 SPCX
SPCX
| Space Exploration Technologies Corp. | 58,062,452 | $108.37 | $113.635 | $107.5701 | $113.096 |
-3.41%
|
|
 SKHY
SKHY
| SK hynix Inc. American Depositary Shares | 45,518,392 | $143.73 | $162.65 | $143.51 | $159.875 |
-3.54%
|
|
 IREN
IREN
| IREN Limited | 63,609,439 | $36.8 | $40.815 | $35.16 | $40.815 |
-3.82%
|
|
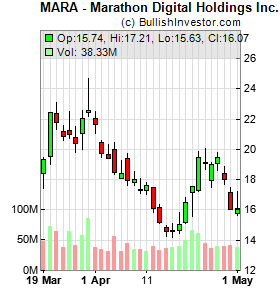 MARA
MARA
| MARA Holdings Inc. | 38,572,527 | $11.32 | $12.07 | $11.07 | $12.02 |
-4.23%
|
|
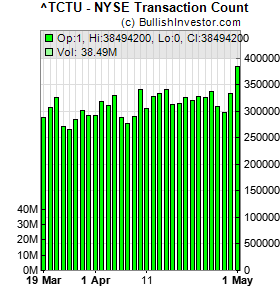 ^TCTU
^TCTU
| NYSE Transaction Count | 51,540,182 | $51540182 | $51540182 | $0 | $1 |
-5.42%
|
|
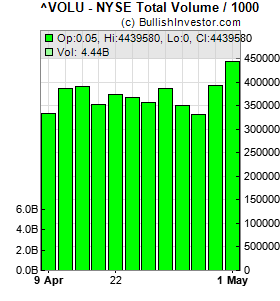 ^VOLU
^VOLU
| NYSE Total Volume / 1000 | 5,091,474,694 | $5091474 | $5091474 | $0 | $0.001 |
-5.59%
|
|
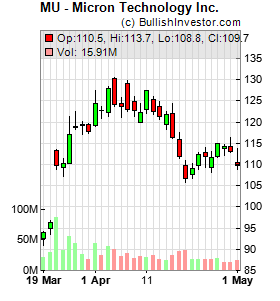 MU
MU
| Micron Technology Inc. | 53,723,817 | $823.03 | $930.88 | $818 | $919.65 |
-5.90%
|
|
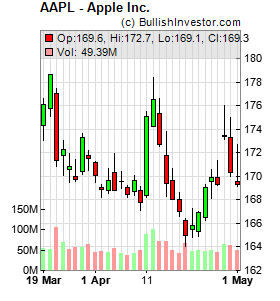 AAPL
AAPL
| Apple Inc. | 131,692,782 | $308.91 | $310.69 | $300 | $304.81 |
-7.35%
|
|
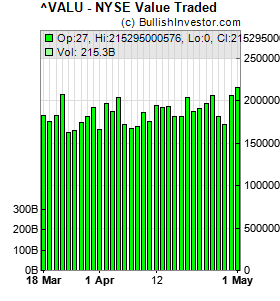 ^VALU
^VALU
| NYSE Value Traded | 295,109,478,689 | $295109478000 | $295109478000 | $0 | $749 |
-7.67%
|
|
 KORU
KORU
| Direxion Daily South Korea Bull 3X | 69,586,640 | $14.99 | $17.74 | $14.83 | $17.33 |
-7.92%
|
|
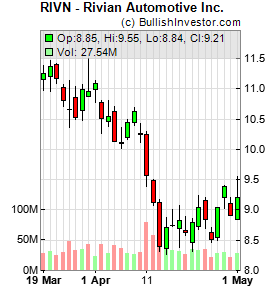 RIVN
RIVN
| Rivian Automotive Inc. | 54,139,400 | $15.22 | $17.18 | $15.145 | $16.97 |
-9.57%
|
|
 MUU
MUU
| Direxion Daily MU Bull 2X Shares | 82,483,862 | $23.67 | $30.29 | $23.38 | $29.64 |
-12.24%
|
|
 WU
WU
| Western Union Company (The) | 55,500,884 | $6.36 | $7.21 | $6.27 | $7.085 |
-17.30%
|
|
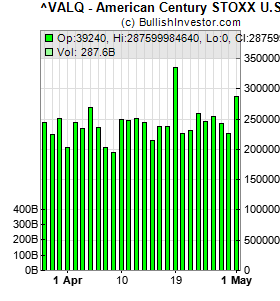 ^VALQ
^VALQ
| American Century STOXX U.S. Quality Value ETF | 437,823,861,614 | $437823861000 | $437823861000 | $0 | $9 |
-19.87%
|
|
 RBLX
RBLX
| Roblox Corporation Class A | 62,869,939 | $35.6 | $40 | $33.88 | $38.88 |
-26.85%
|
|